Reviewed by David J. Cowhey, Certified by the Supreme Court of New Jersey as a Civil Trial Attorney · Updated October 9, 2026
This page collects the most reliable statistics on dog bites to children in the United States. Every figure below comes from a government agency, a peer-reviewed study, or the insurance industry, and the source and year are listed with each number. We also include original data from our own New Jersey child dog bite cases.
Child Dog Bite Statistics: Key Numbers
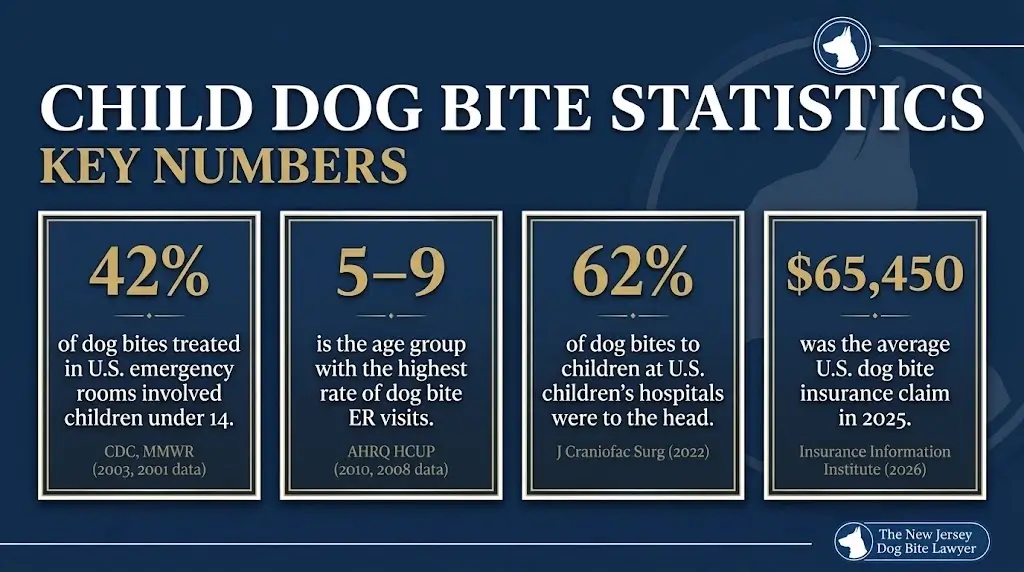
• About half of all dog bite victims in the United States are children, according to the American Veterinary Medical Association (2026).
• An estimated 154,625 children under 14 were treated in U.S. emergency departments for dog bites in 2001, according to the CDC (2003).
• Children aged 5 to 9 had a dog bite emergency room visit rate of 199.3 per 100,000, the highest of any age group, according to AHRQ (2010, 2008 data).
• U.S. children’s hospitals treated 56,106 children for dog bites from 2015 to 2020, according to a study in the Journal of Craniofacial Surgery (2022).
• In 61.7% of U.S. head and neck dog bites to children, the dog was known to the child, according to a national NEISS study in the Journal of Craniofacial Surgery (2024).
• Dog bite insurance claims in the U.S. rose 25.6% from 2024 to 2025, reaching 28,450 claims, according to the Insurance Information Institute (2026).
How Many Children are Bitten by Dogs Each Year in the U.S.?
• An estimated 368,245 people were treated in U.S. emergency departments for dog bites in 2001, according to the CDC’s Morbidity and Mortality Weekly Report (2003).
• About 154,625 of those emergency room patients, or 42.0%, were children under 14, according to the CDC (2003).
• U.S. emergency departments recorded 316,200 dog bite visits in 2008, according to the Agency for Healthcare Research and Quality (2010).
• About half of dog bite victims in the U.S. are children, according to the American Veterinary Medical Association (2026).
• A national study of U.S. children’s hospitals in the Pediatric Health Information System counted 56,106 pediatric dog bite patients from 2015 to 2020, according to the Journal of Craniofacial Surgery (2022).
• Pediatric head and neck dog bites in U.S. emergency rooms rose significantly each year from 2013 to 2022, according to a NEISS database study in the Journal of Craniofacial Surgery (2024).
There is no single national count of every dog bite. Many bites are never reported or treated at home, so emergency department figures undercount the true total.
U.S. Dog Bite Statistics by Age
Dog bite emergency room visits per 100,000 people, by age (2008)
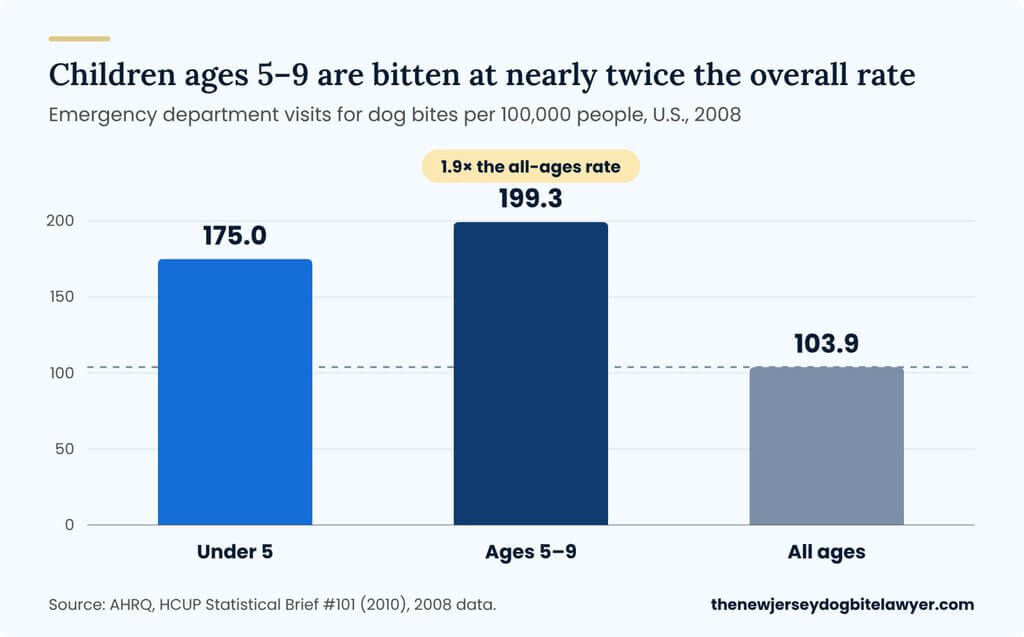
Source: AHRQ, HCUP Statistical Brief #101 (2010), 2008 data. Children aged 5 to 9 are bitten at nearly twice the rate of the population as a whole.
• Children aged 5 to 9 had the highest dog bite injury rate of any age group in the U.S., according to the CDC (2003).
• Children under 5 had a dog bite emergency room visit rate of 175.0 per 100,000, compared with 103.9 per 100,000 for all ages, according to AHRQ (2010, 2008 data).
• Boys under 14 had a dog bite injury rate of 293.2 per 100,000, compared with 216.7 for girls, according to the CDC (2003).
• The median age of children treated for dog bites at U.S. children’s hospitals was 6.8 years, according to the Journal of Craniofacial Surgery (2022).
• Children aged 2 to 6 made up 43.4% of U.S. pediatric head and neck dog bite cases, according to the Journal of Craniofacial Surgery (2024).
• Pediatric dog bites peak in July and are lowest in February, according to the Journal of Craniofacial Surgery (2022).
Analysis on Dog Bites to Children’s Face, Head and Neck
Children are far more likely than adults to be bitten on the face. Their faces are closer to a dog’s mouth, and young children often lean in, hug, or put their face near a dog.
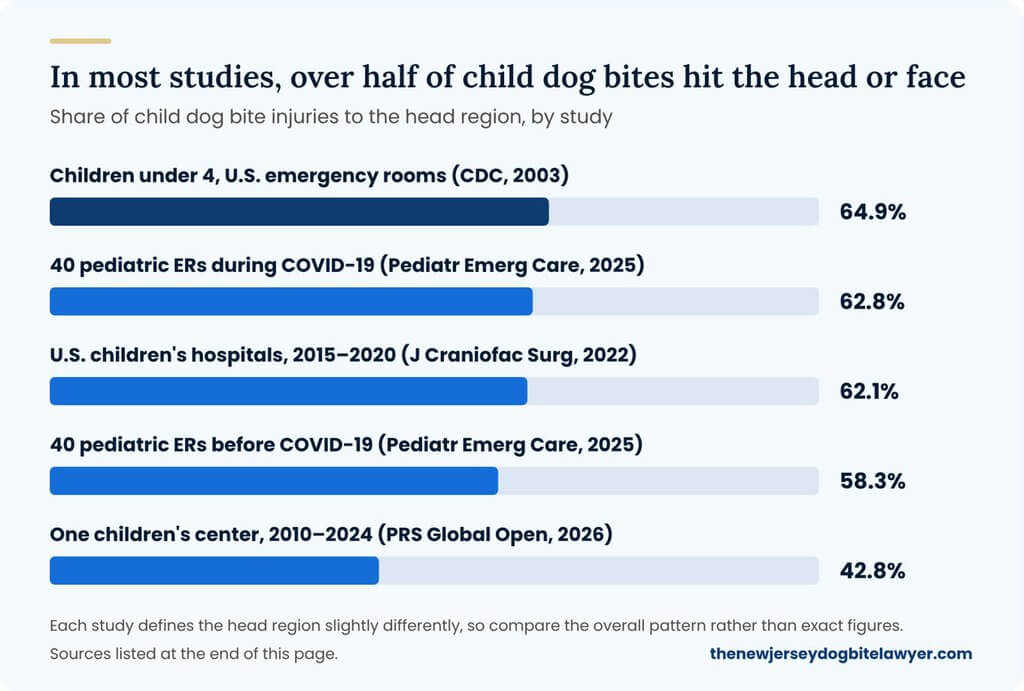
Share of child dog bites to the head, face, or neck, by study.
Each study defines the head region slightly differently, so compare the overall pattern rather than exact figures. Sources listed at the end of this page.
• 64.9% of dog bite injuries to U.S. children under 4 were to the head or neck, according to the CDC (2003).
• 62.1% of dog bites treated at U.S. children’s hospitals were to the head, according to the Journal of Craniofacial Surgery (2022).
• 77.7% of U.S. children with head and neck dog bites had injuries to the face or mouth, according to the Journal of Craniofacial Surgery (2024).
• The share of dog bites to a child’s face falls by about 3.4 percentage points for each year of age, according to the Journal of Craniofacial Surgery (2022).
• Infants were more than 6 times as likely to be bitten on the head or neck, according to a study of 1,616 dog bite injuries in Clinical Pediatrics (2017).
• Children were twice as likely as adults to suffer a dog bite around the eye, according to the Journal of Oral and Maxillofacial Surgery (2020).
• 92.7% of children with dog bites around the eye at Texas Children’s Hospital had eyelid lacerations, according to Ophthalmic Plastic and Reconstructive Surgery (2026).
• 12.0% of children with dog bites around the eye at Texas Children’s Hospital had orbital fractures, according to Ophthalmic Plastic and Reconstructive Surgery (2026).
Are Children Usually Bitten by a Dog They Know?
Yes. Most serious bites to children come from a family dog, a relative’s dog, or a neighbor’s dog, not a stray.
U.S. child head and neck dog bites, 2013–2022
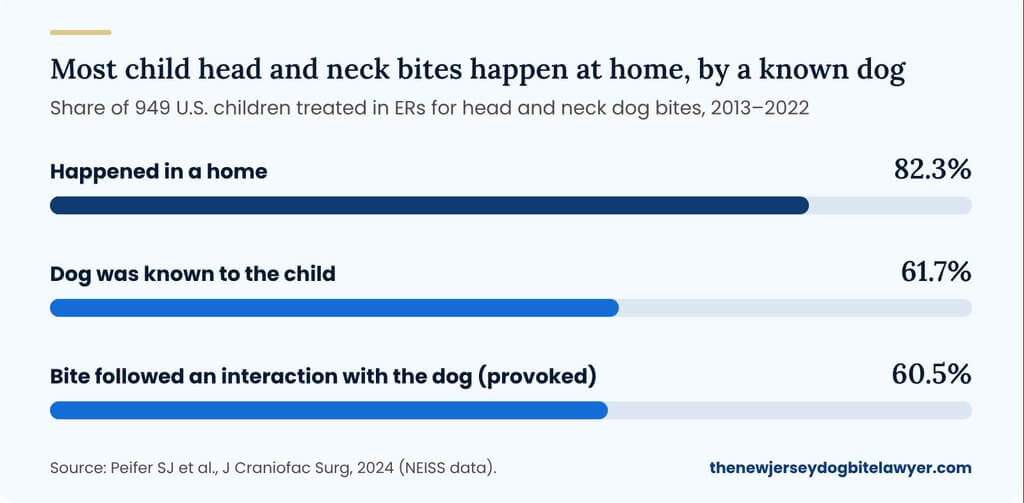
• 82.3% of U.S. head and neck dog bites to children happened in a home, according to the Journal of Craniofacial Surgery (2024).
• 61.7% of U.S. head and neck dog bites to children involved a dog the child knew, according to the Journal of Craniofacial Surgery (2024).
• Infants were more than 4 times as likely to be bitten by the family dog, according to Clinical Pediatrics (2017).
• 66% of dogs referred to a veterinary behavior clinic after biting a child had never bitten a child before, according to Injury Prevention (2007).
• Children under 6 were most often bitten when a dog was guarding food or a toy (44%), according to Injury Prevention (2007).
“Provoked” in medical studies usually means a child was touching, hugging, or playing near the dog. In New Jersey, a dog owner is still strictly liable for a bite to a child under N.J.S.A. 4:19-16, whether or not the dog had bitten before.
Child Dog Bite Hospitalization and Surgery Statistics
• 8.0% of children treated for dog bites at U.S. children’s hospitals needed repair in an operating room, according to the Journal of Craniofacial Surgery (2022).
• Children with bites only to the head were 2.6 times as likely to need surgery in an operating room, according to the Journal of Craniofacial Surgery (2022).
• 58% of dog bite patients at one U.S. center needed laceration repair, according to Clinical Pediatrics (2017).
• Children 5 and under were 62% more likely to need laceration repair, according to Clinical Pediatrics (2017).
• 12.9% of children seen in pediatric emergency rooms for dog bites were admitted to the hospital during the COVID-19 pandemic, compared with 11.4% before it, according to Pediatric Emergency Care (2025).
• The average U.S. hospital stay for a dog bite cost $18,200 in 2008, about 50% more than the average injury-related stay, according to AHRQ (2010).
• Head and neck dog bites in children needed complex reconstruction more often than bites elsewhere (8.2% vs. 2.4%), according to PRS Global Open (2026).
• Deeper wounds, not dog breed, best predicted abnormal scarring in children, according to PRS Global Open (2026).
Many children need scar revision years later. See our guide to recovering plastic surgery costs after a dog bite.
Dog Bite Data After the COVID Pandemic
• Dog bites made up 1.6% of all child injuries seen in 40 pediatric emergency rooms during the COVID-19 pandemic, up from 1.1% before it, according to Pediatric Emergency Care (2025).
• Children aged 5 to 9 made up 36.3% of pediatric dog bite cases during the pandemic, up from 33.0% before it, according to Pediatric Emergency Care (2025).
• Dog bites to children’s head, face, or neck rose to 62.8% of cases during the pandemic, from 58.3% before it, according to Pediatric Emergency Care (2025).
• U.S. children’s hospitals saw a spike in dog bites as a share of all emergency visits during the pandemic, according to the Journal of Craniofacial Surgery (2022).
Dog Breeds in Child Dog Bite Statistics
• Pit bulls were the most common breed in U.S. head and neck dog bites to children, at 33.1% of cases, according to the Journal of Craniofacial Surgery (2024).
• Pit bulls made up 47.9% of bites where the breed was known at one U.S. children’s center from 2010 to 2024, according to PRS Global Open (2026).
• Pit bull bites were involved in half of all surgeries at one U.S. center and were 2.5 times as likely to cause bites in multiple places on the body, according to Clinical Pediatrics (2017).
• Injury management and outcomes did not differ significantly by breed, according to PRS Global Open (2026).
Breed is often reported by the family or hospital staff and may not be accurate. Any dog can seriously injure a child.
Psychological Effects of Dog Bites on Children
• A 2024 review of 23 studies with 1,894 participants found that post-traumatic stress disorder, fear of dogs, nightmares, and anxiety were the most common psychological effects of dog bites in children, according to BMJ Paediatrics Open (2024).
• The same review found that studies on the psychological effects of dog bites in children are sparse, according to BMJ Paediatrics Open (2024).
Child Dog Bite Death Data Nationwide
• An average of about 19 people a year died from dog attacks in the U.S. from 1979 to 2005, according to a CDC WONDER analysis in Wilderness & Environmental Medicine (2009).
• Children under 10 had the highest rate of death from dog attacks in the U.S., according to Wilderness & Environmental Medicine (2009).
There is no current official national registry of fatal dog attacks. The figures above are the most recent peer-reviewed national analysis we found.
Insights on Dog Bite Insurance Claims
Most dog bite claims, including claims for children, are paid by the dog owner’s homeowners or renters insurance.
U.S. dog bite insurance claims per year, 2021–2025
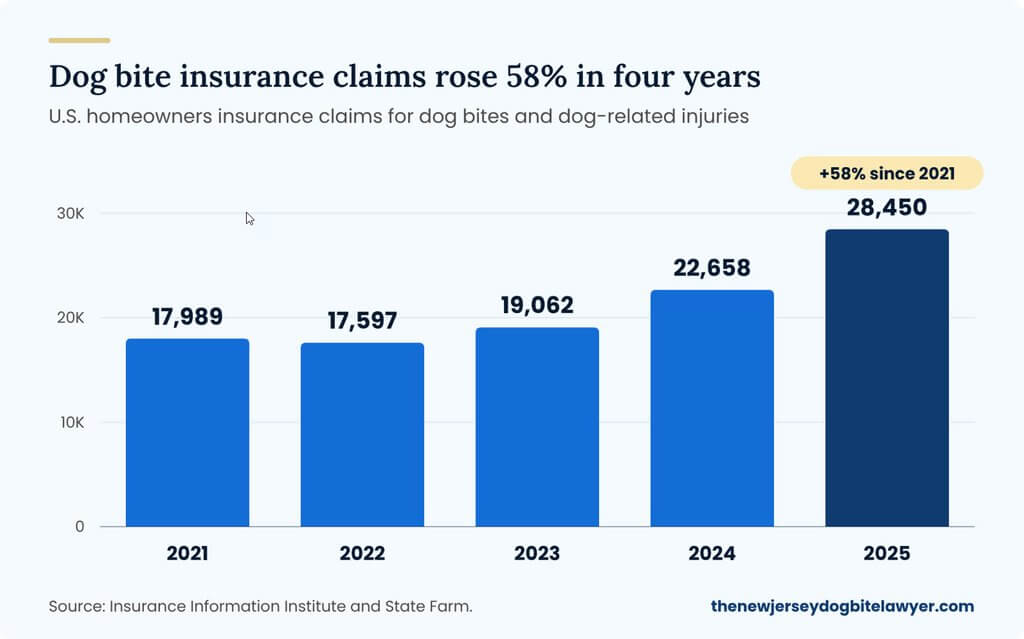
Source: Insurance Information Institute and State Farm (2026). Claims cover all ages, not only children.
| Year | Claims | Total paid | Average per claim |
| 2025 | 28,450 | $1.86 billion | $65,450 |
| 2024 | 22,658 | $1.57 billion | $69,272 |
| 2023 | 19,062 | $1.12 billion | $58,545 |
| 2022 | 17,597 | $1.14 billion | $64,555 |
| 2021 | 17,989 | $881.9 million | $49,025 |
• U.S. insurers paid $1.86 billion in dog bite claims in 2025: Insurance Information Institute (2026).
• The average U.S. dog bite insurance claim was $65,450 in 2025: Insurance Information Institute (2026).
• The number of U.S. dog bite insurance claims rose 25.6% from 2024 to 2025: Insurance Information Institute (2026).
• The number of U.S. dog bite insurance claims rose about 58% from 2021 to 2025: Insurance Information Institute data (2026).
The Data on New Jersey Dog Bites
• New Jersey had 818 dog bite insurance claims in 2025, according to the Insurance Information Institute (2026).
• New Jersey ranked 10th among U.S. states for dog bite claims in 2025, according to the Insurance Information Institute (2026).
• The average New Jersey dog bite claim was $77,447 in 2025, about $12,000 more than the national average, according to the Insurance Information Institute (2026).
• Insurers paid about $63 million on New Jersey dog bite claims in 2025, according to the Insurance Information Institute (2026).
Sources and Methodology: We used only government data, peer-reviewed medical studies, insurance industry data, and our own published case results. We did not use figures from advocacy groups or unsourced websites. National dog bite data is collected in different ways and years, so each figure includes its source and year. We check these sources regularly and update this page when new data is published.
Sources:
1. CDC. Nonfatal dog bite-related injuries treated in hospital emergency departments, United States, 2001. MMWR, 2003.
2. AHRQ. Emergency Department Visits and Inpatient Stays Involving Dog Bites, 2008. HCUP Statistical Brief #101, 2010.
3. American Veterinary Medical Association. Dog bite prevention. 2026.
4. Insurance Information Institute. Spotlight on: Dog bite liability. 2026.
5. Pediatric Dog Bite Injuries: A 5-Year Nationwide Study and Implications of the COVID-19 Pandemic. Journal of Craniofacial Surgery, 2022.
6. Pediatric Head and Neck Dog Bites in the United States: A NEISS Database Investigation. Journal of Craniofacial Surgery, 2024.
7. Pediatric Dog Bite Injury Trends During the COVID-19 Pandemic. Pediatric Emergency Care, 2025.
8. Characteristics of 1616 Consecutive Dog Bite Injuries at a Single Institution. Clinical Pediatrics, 2017.
9. Breed-specific Risk Factors and Clinical Outcomes in Pediatric Dog Bite Injuries. Plastic and Reconstructive Surgery Global Open, 2026.
10. Children Have an Increased Risk of Periorbital Dog Bite Injuries. Journal of Oral and Maxillofacial Surgery, 2020.
11. Characterization, Epidemiology, and Outcomes of Periocular Dog Bites in Children. Ophthalmic Plastic and Reconstructive Surgery, 2026.
12. Behavioral assessment of child-directed canine aggression. Injury Prevention, 2007.
13. Review of psychological effects of dog bites in children. BMJ Paediatrics Open, 2024.
14. Human fatalities resulting from dog attacks in the United States, 1979–2005. Wilderness & Environmental Medicine, 2009.